Comparing Relative Bioluminescence: Using the Power of DSLR Cameras to measure bioluminescence

Bioluminescence, the ability of living organisms to produce light, has fascinated scientists and nature enthusiasts for centuries. From shimmering fireflies to glowing deep-sea creatures, this natural phenomenon continues to captivate our imagination. Bioluminescent organisms, such as phytoplankton, play a crucial role in various ecosystems, making understanding their lifecycle and ideal environment essential. This article will explore the intriguing process of using a DSLR camera to measure relative bioluminescence and optimize the study of bioluminescent organisms.
Most laboratories use an instrument called a luminometer to measure bioluminescence. However, a luminometer that can measure bioluminescence is expensive, and most luminometers can not measure bioluminescence while the organism is in motion (ie, being induced).
Capturing the Magic in Darkness:
One of the challenges when studying bioluminescence lies in its elusive nature, often occurring in low-light conditions or complete darkness. To overcome this obstacle, utilizing a DSLR camera with exceptional low-light capabilities, like the Sony A7SII, can prove invaluable. Equipped with a full-frame sensor and impressive ISO performance, this camera excels at capturing detail even in extremely dim environments.
To begin, one should set up their DSLR camera on a stable tripod and adjust the camera settings for optimal low-light photography. The camera should be set to manual mode to have complete control over exposure settings. Start by setting the ISO to a high value to capture as much light as possible. Additionally, select a wide aperture (low f-number) to maximize light intake and set the shutter speed to a longer duration to allow enough time for light to reach the sensor. We used a Manual setting of F1.4, 1/250 and a high ISO of 51200. We captured image as raw, files (ARW)
Prepare the environment: To ensure accurate measurements, conduct the experiment in complete darkness, preferably in a controlled environment or in a secluded outdoor location far from any artificial light sources.
Set up the camera: Mount your camera on a sturdy tripod to eliminate any potential blurring caused by hand movements. Adjust the camera settings to maximize sensitivity while maintaining image quality. Use a wide aperture, lower ISO, and longer exposure time to capture more light and enhance the visibility of bioluminescence.
Analyzing Bioluminescence with Adobe Photoshop:
After capturing images of the bioluminescent organisms in total darkness, the next step is to analyze the relative luminosity of these images. Adobe Photoshop provides a robust set of tools, including the histogram function, that allows for precise analysis and comparison.
- Import and Open Images: Transfer the captured images to your computer and open them in Adobe Photoshop.
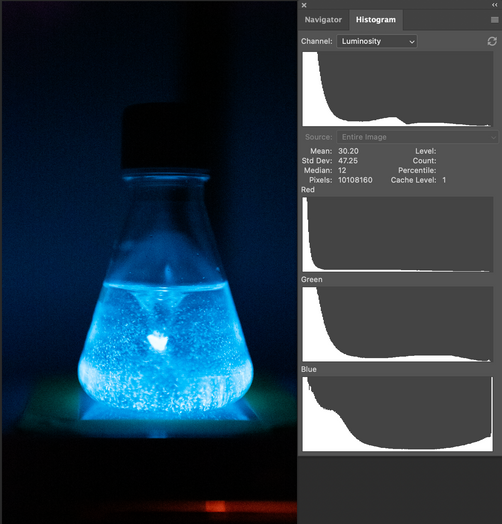
- Evaluate Histograms: The histogram function in Photoshop provides a graphical representation of the luminosity values within an image. To access it, go to Window > Histogram. The histogram will display the distribution of pixel luminosity, ranging from shadows (blacks) to highlights (whites).
- Compare Histograms: Compare the histogram values of different treatments and conditions to determine the relative luminosity. A higher peak in the histogram indicates a greater intensity of bioluminescence in the corresponding image.
- Further Analysis: Photoshop offers additional tools, such as the Eyedropper tool and the Info panel, that enable quantitative measurements of pixel luminosity values. These tools can help derive more precise comparisons and identify subtle differences in bioluminescent intensity.
Example Test Case with Histogram data:
Shown here is a small part of an experiment we did in collaboration with The University of Veracruz, Mexico, (Universidad Veracruzana). We used the described method to determine bioluminescent activation of PyroDinos over time at different RPM settings on stir plate. The three images below show activation of 200ml PyroDinos at 10sec, 60sec and 120sec at 300 RPMs
10 seconds @ 300 RPM

60 seconds @ 300 RPM

120 seconds @ 300 RPM

This experiment was done in collaboration with our friend and colleague, America Alejandra Miranda Curiel, Biologist, The University of Veracruz, Mexico.
Unveiling Insights through Comparison:
By comparing multiple images of bioluminescence using the histogram function in Adobe Photoshop, researchers and enthusiasts can gain valuable insights into the activation factors that optimize bioluminescent displays. This analytical approach enables the identification of key variables impacting the intensity and duration of bioluminescence in different organisms.
Scientists can use this method to study the effects of environmental conditions, such as temperature, pH, and nutrient availability, on bioluminescence. Moreover, the technique can help evaluate the best conditions for bioluminescent activation.
**GrowPro Flasks were used in this experiment.


Comments